The West Loop area, known for its vibrant real estate market, has shown intriguing trends over the past three months. In this post, we dive deep into the numbers, providing insights and analyses on what’s happening in this dynamic area.
Market Overview
The West Loop real estate market demonstrates a diverse range of listings, with varying price ranges and days on the market. Key figures from the past three months reveal the following trends:
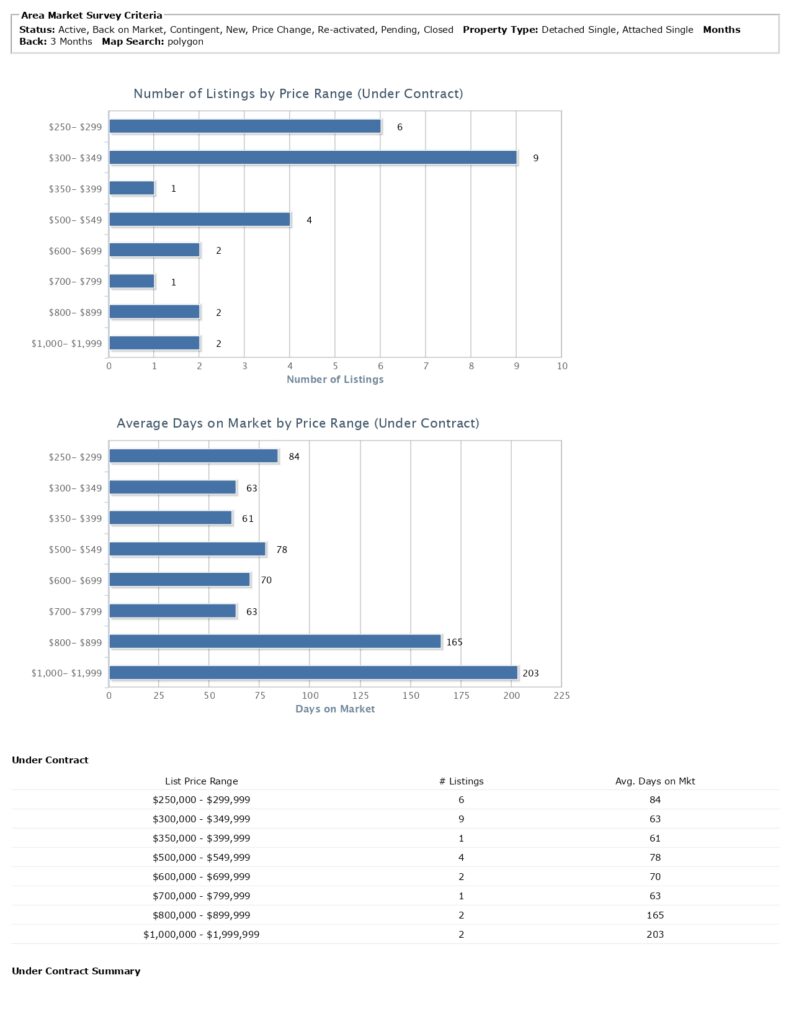
Under Contract Listings: The most popular price range for properties under contract is between $300,000 and $349,000, with 9 listings and an average of 63 days on the market. This is followed by the $500,000 to $549,000 range, with 4 listings averaging 78 days. Notably, the $1,000,000 to $1,999,999 range also had 2 listings, but with a significantly higher average market time of 203 days.
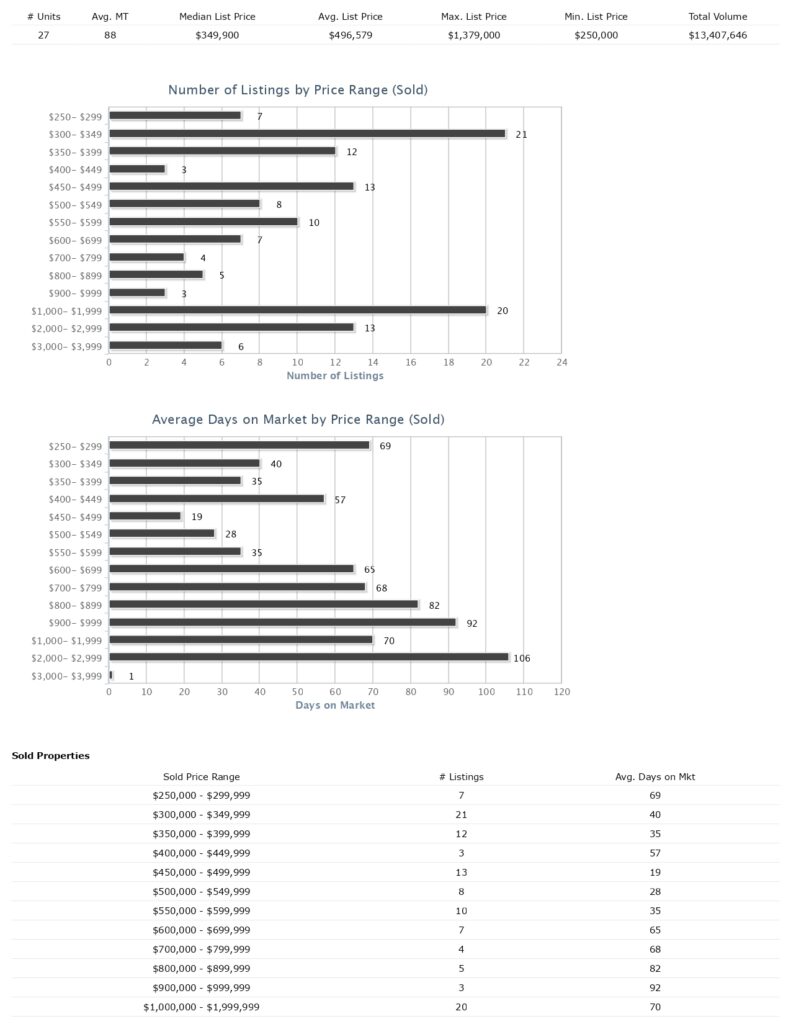
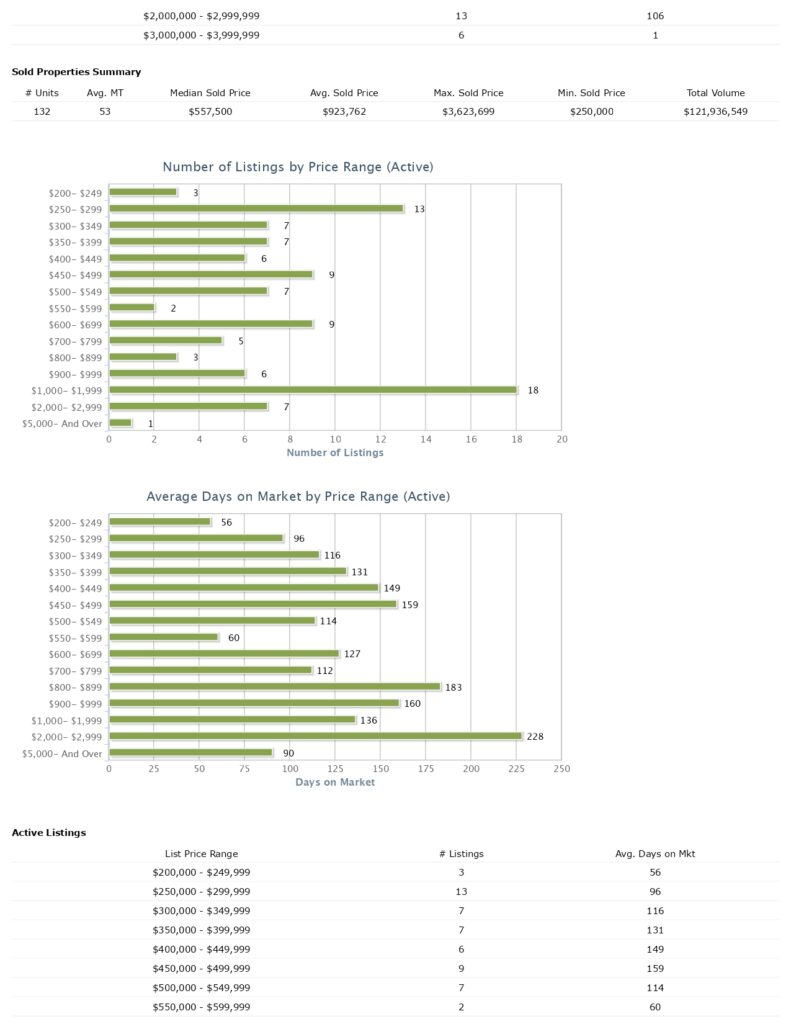
Sold Properties: The $300,000 to $349,000 price range saw the highest number of sold listings at 21, averaging 40 days on the market. Interestingly, the $1,000,000 to $1,999,999 bracket also performed well, with 20 listings sold and an average market time of 70 days. The median sold price in the West Loop for this period was $557,500, with the maximum sold price reaching $3,999,999.
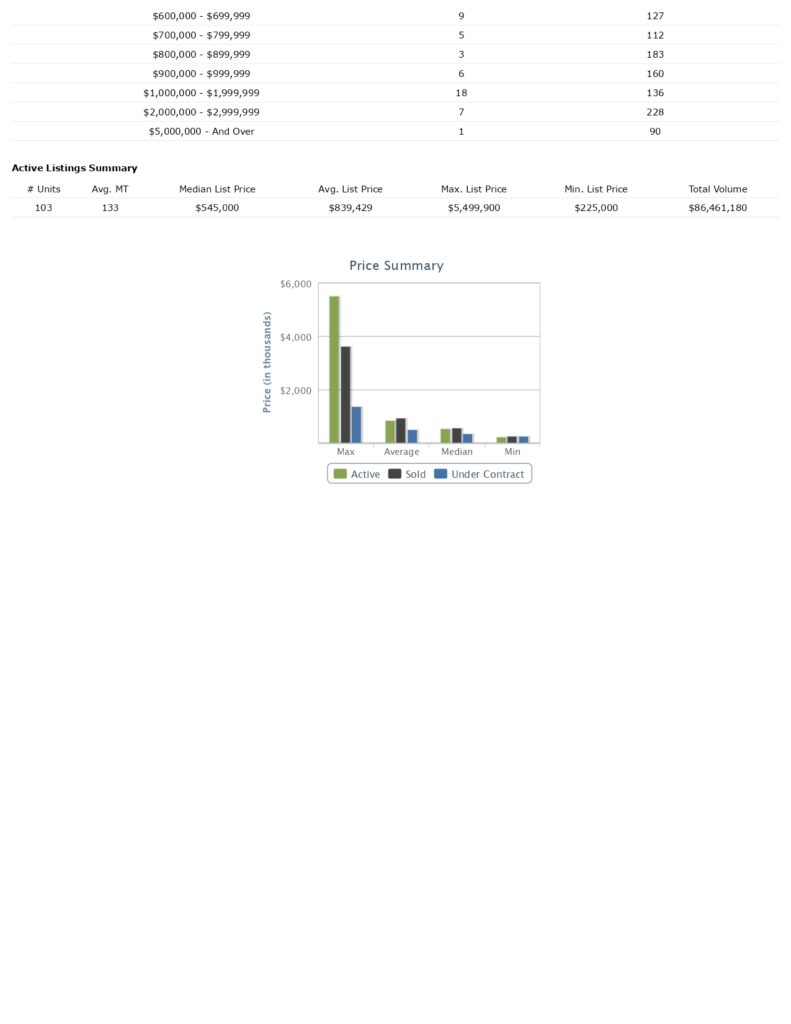
Active Listings: The $250,000 to $299,999 price range is currently the most active, with 13 listings averaging 96 days on the market. The upper-tier market, particularly the $1,000,000 to $1,999,999 range, also shows considerable activity with 18 listings, albeit with a longer average market time of 136 days.
Market Dynamics
The data indicates a robust demand for mid-range properties, with significant activity in both the under-contract and sold categories. The luxury market (above $1,000,000) shows a slower turnover but maintains a steady presence in terms of listings and sales.
Price Increases/Decreases: Comparing the median list price ($545,000) to the median sold price ($557,500) reveals a positive trend, indicating a healthy market where properties are selling at or above the asking price.
Market Time Trends: The average market time for sold properties was 40 days, a reasonable timeframe that suggests a balanced market. However, the higher-end listings tend to stay longer on the market, as evidenced by the 203-day average for the $1,000,000 to $1,999,999 under-contract listings.
The West Loop’s real estate market shows a healthy mix of demand across various price ranges. Mid-range properties, particularly between $300,000 and $700,000, are moving quickly, indicating strong buyer interest. The luxury segment, while slower, still shows significant activity, suggesting a diversified and resilient market.
Stay tuned for more updates on the West Loop real estate market. For personalized advice on buying or selling in this area, feel free to reach out to me!


